Creates a set of plot summarising a mutation file.
Value
Returns a list of the following plots:
varclass Barplot of counts of each variant classification
vartype Barplot of counts of each variant type
snvclass Histogram of counts of each SNV class
samplevar Histogram of counts variants per patient
topgenes Barplot of counts of top variant genes
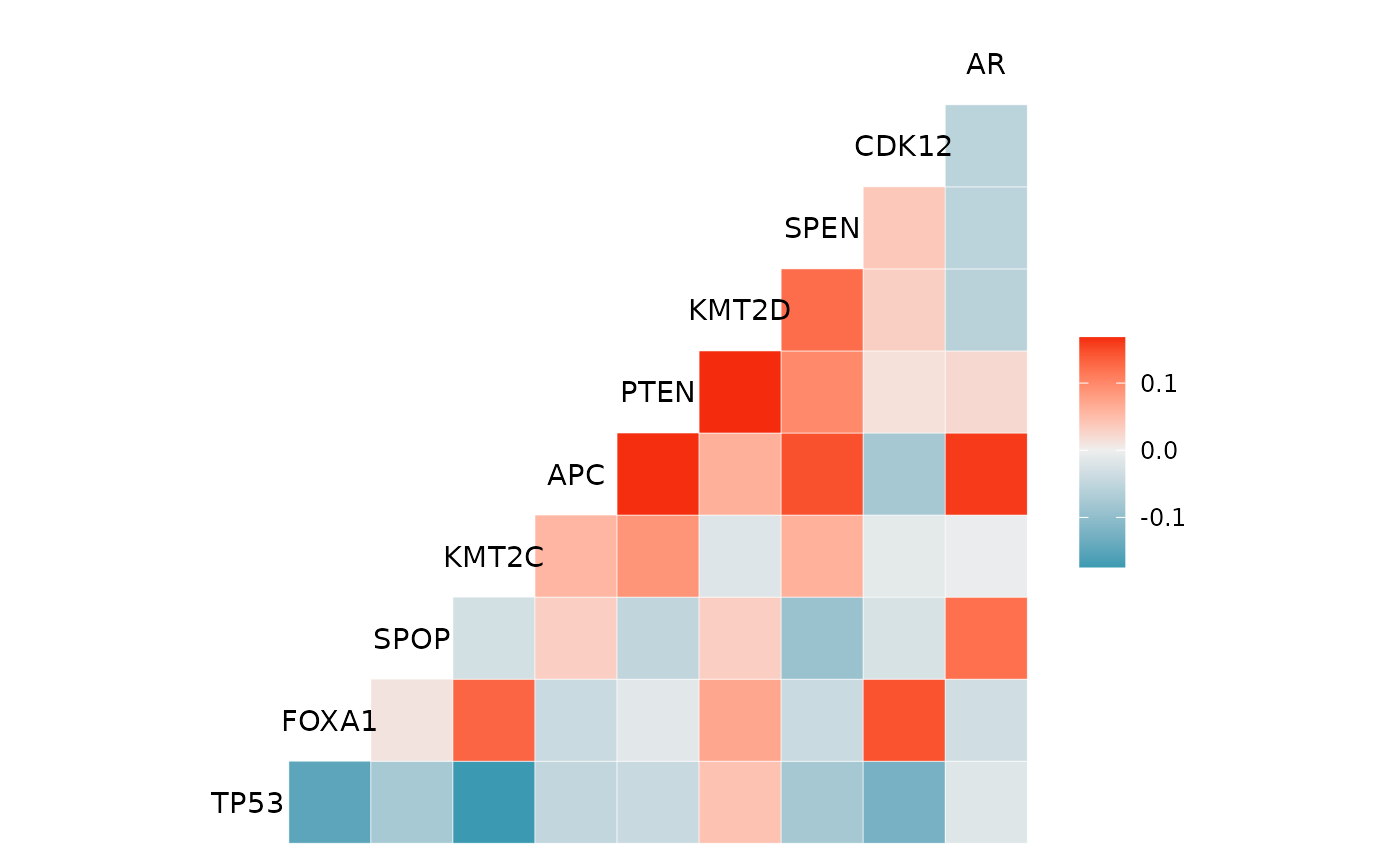
genecor Correlation heatmap of the top 10 genes
Examples
mutation_viz(gnomeR::mutations)
#> ! `samples` argument is `NULL`. We will infer your cohort inclusion and resulting data frame will include all samples with at least one alteration in mutation, fusion or cna data frames
#> ! 7 mutations have `NA` or blank in the mutation_status column instead of 'SOMATIC' or 'GERMLINE'. These were assumed to be 'SOMATIC' and were retained in the resulting binary matrix.
#> $varclass
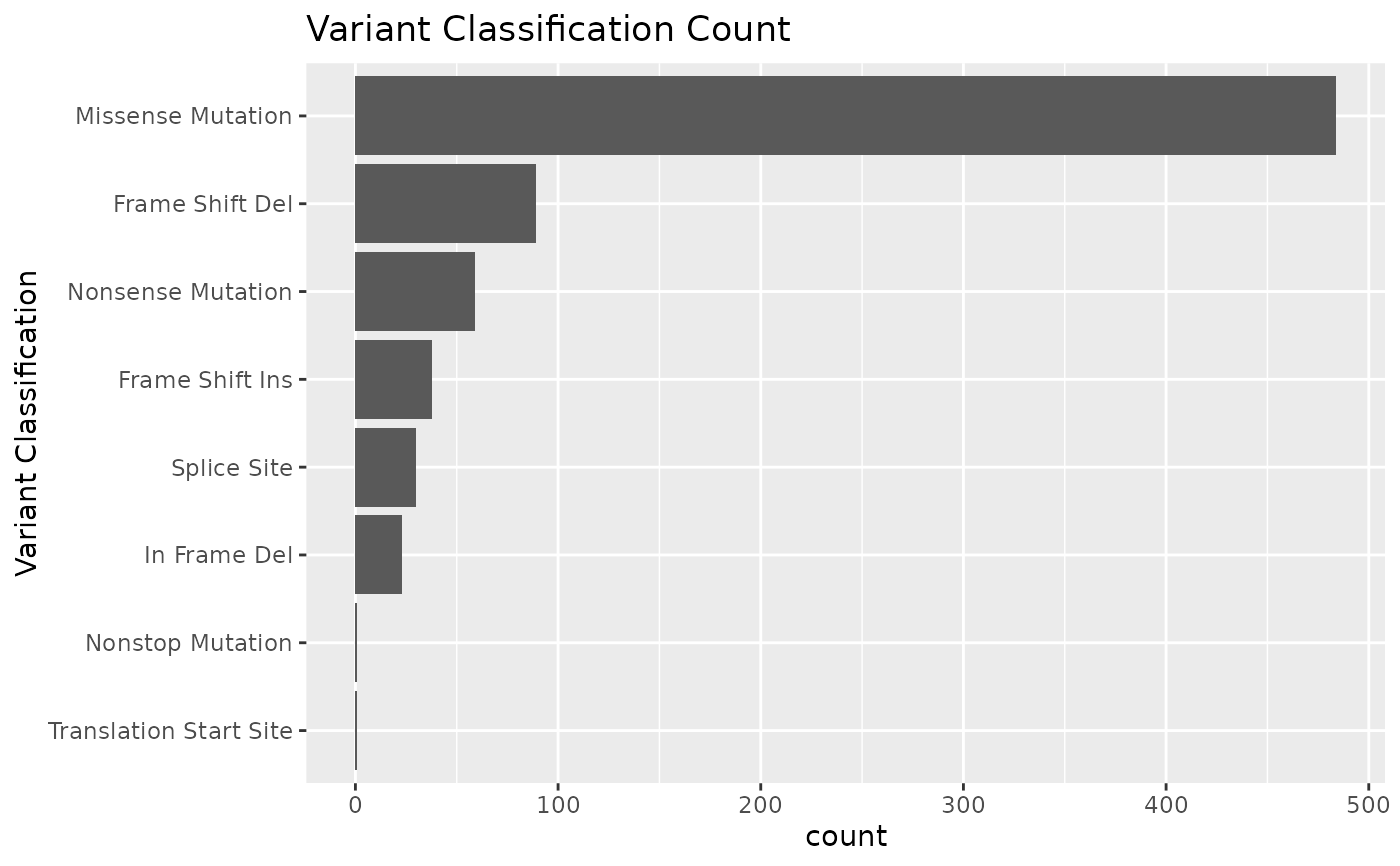 #>
#> $vartype
#>
#> $vartype
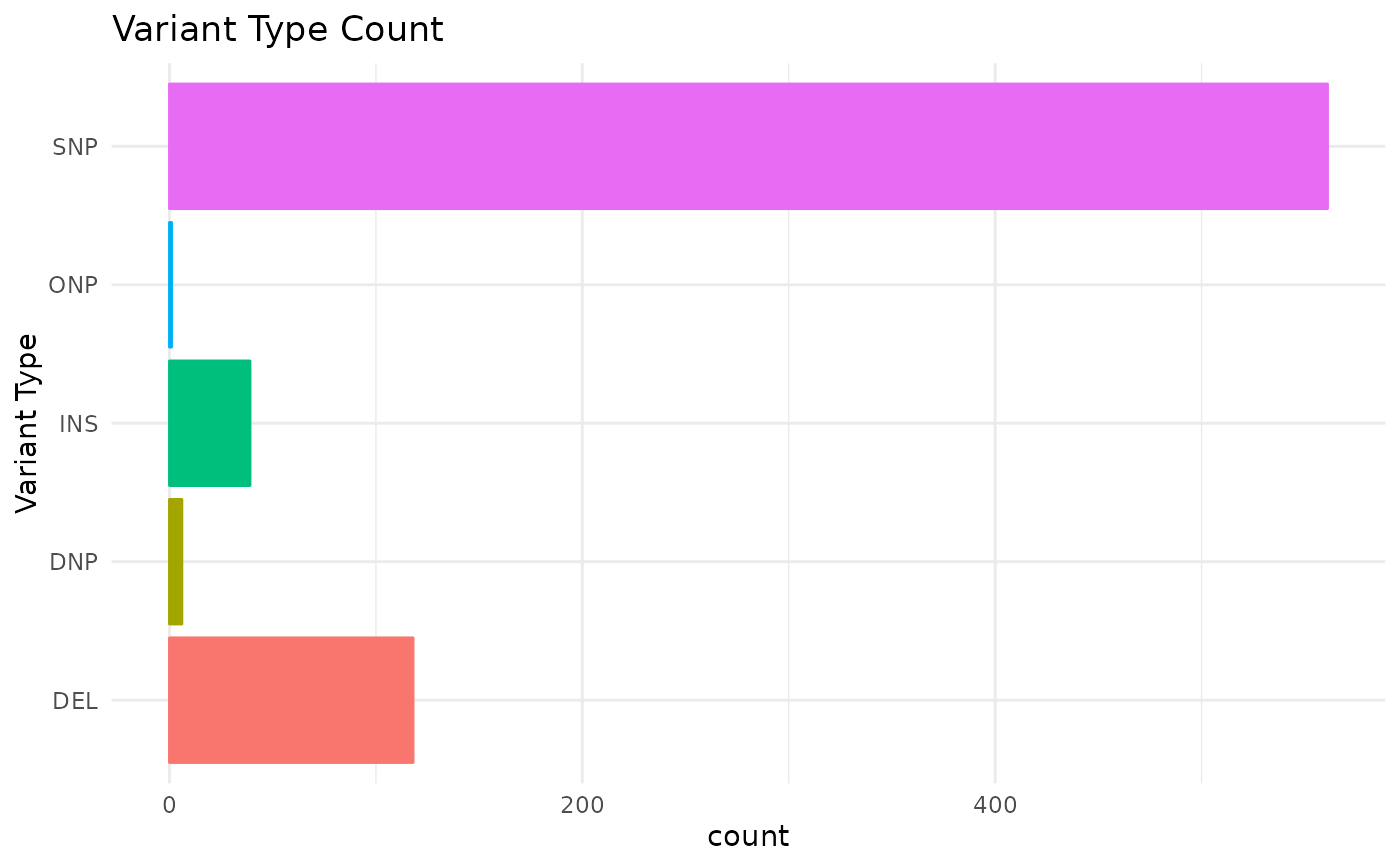 #>
#> $samplevar
#>
#> $samplevar
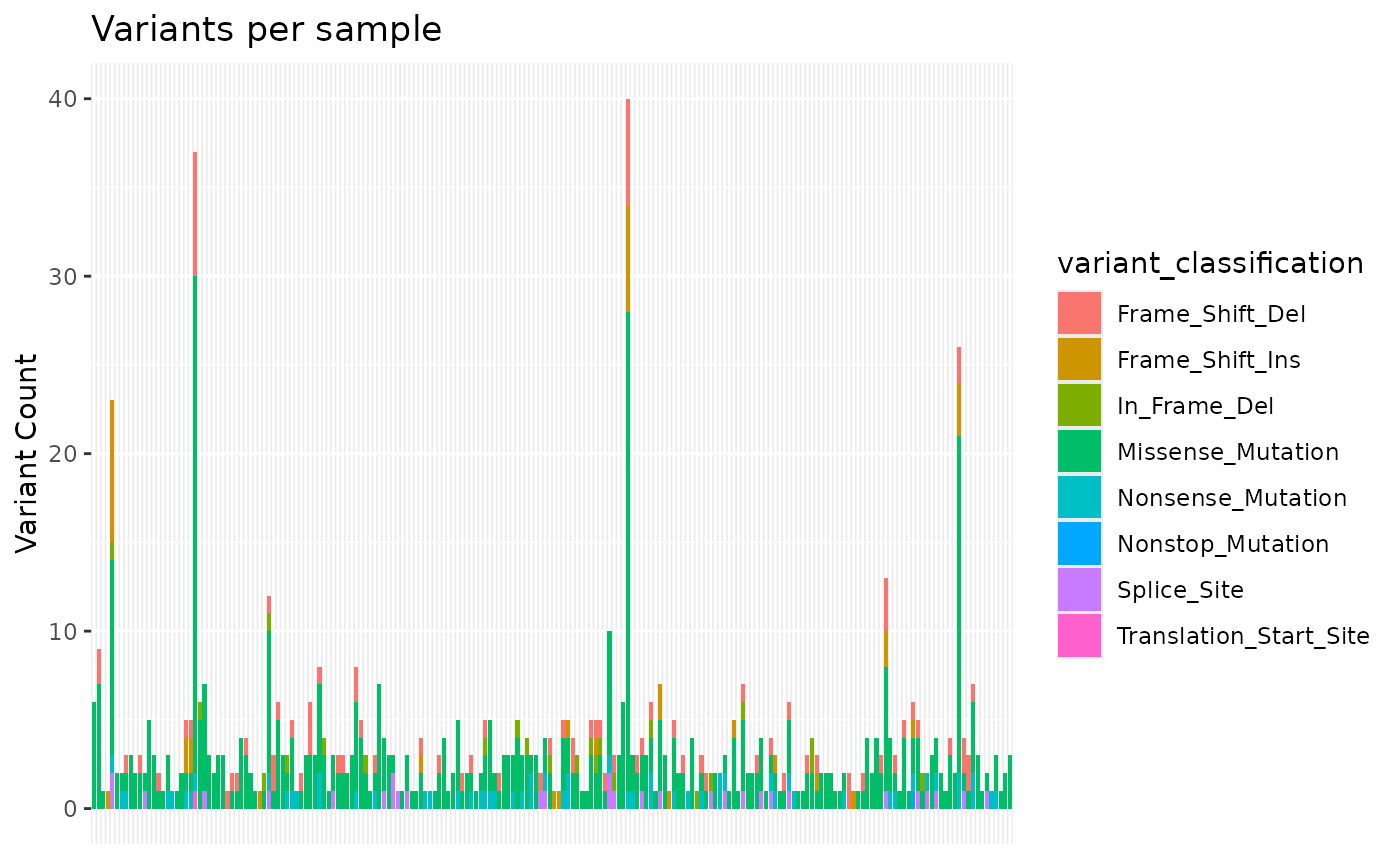 #>
#> $topgenes
#>
#> $topgenes
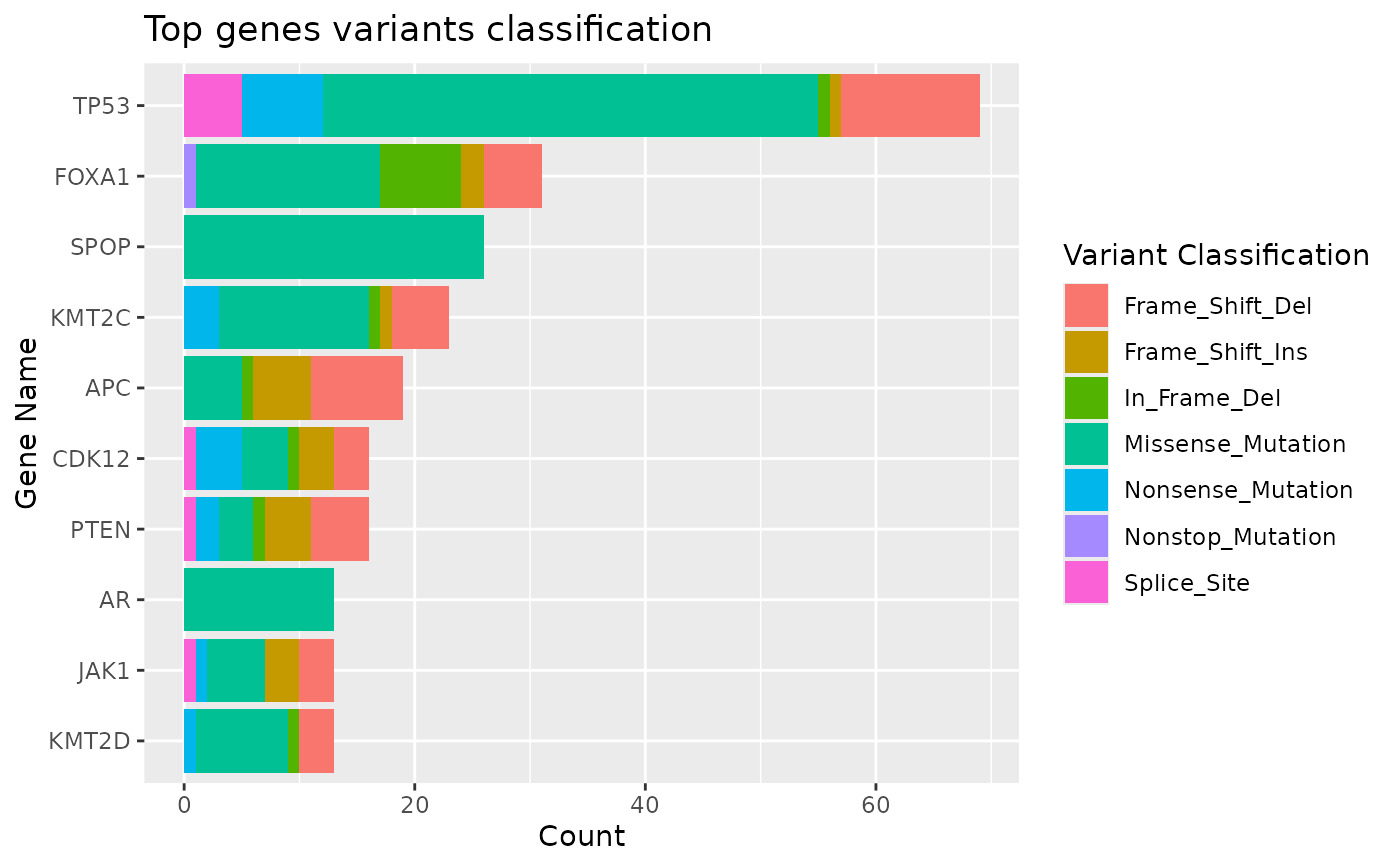 #>
#> $genecor
#>
#> $genecor
 #>
#>