R/plotting-functions.R
ggtopgenes.Rd
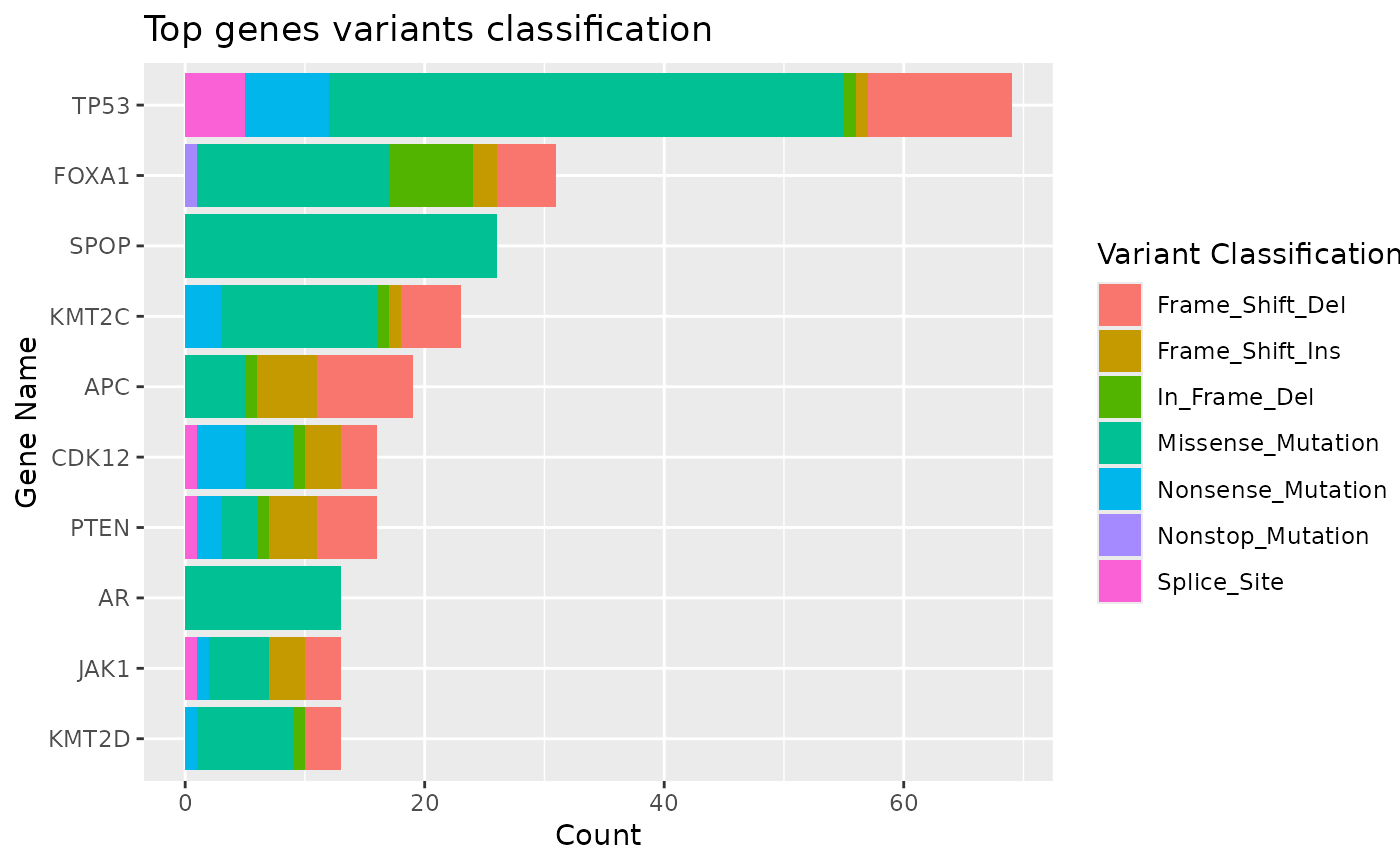
Barplot of Most Frequently Altered Genes
ggtopgenes(mutation, n_genes = 10)
Raw mutation dataframe containing alteration data
Number of top genes to display in plot
Barplot of counts of top variant genes
ggtopgenes(gnomeR::mutations)