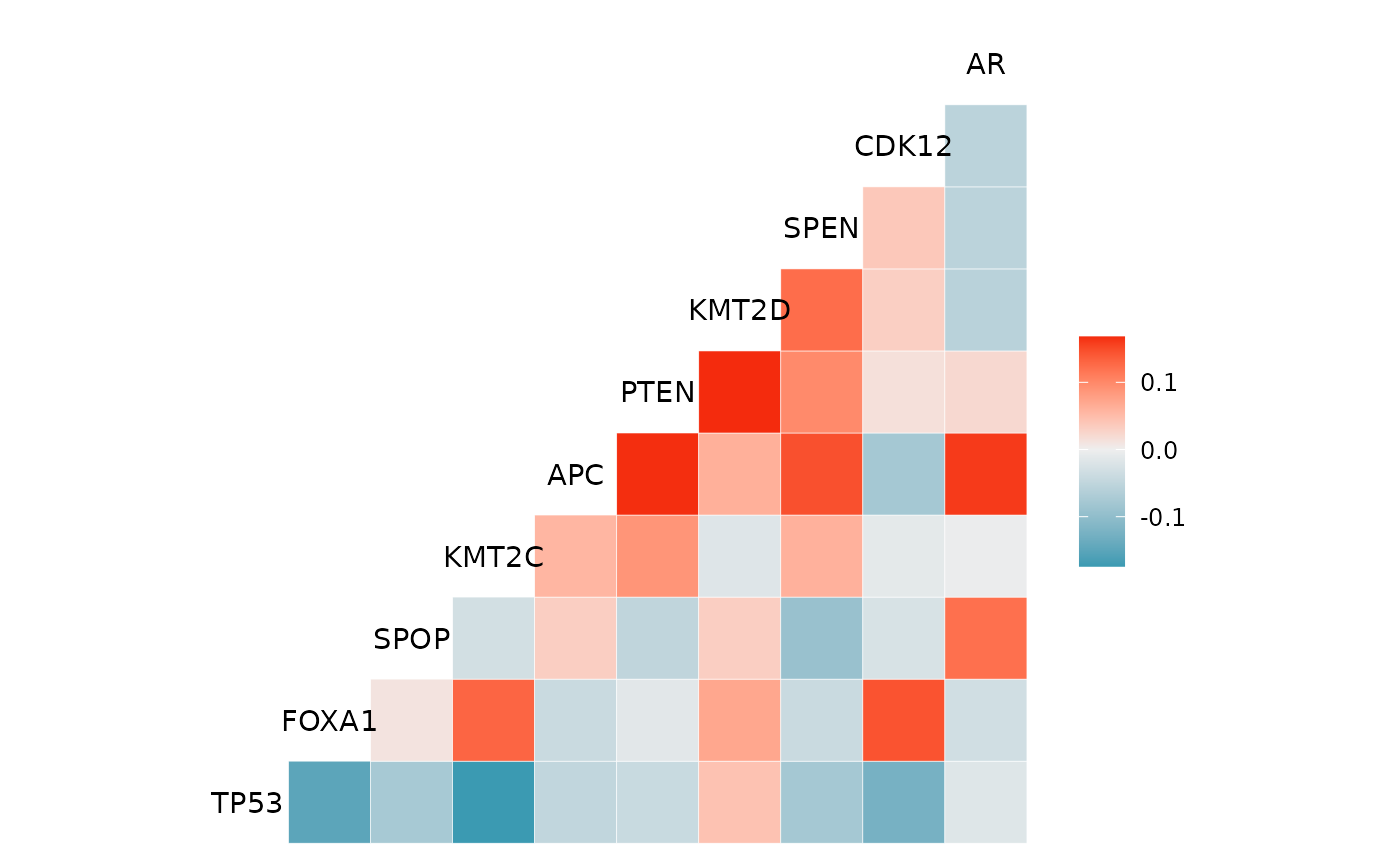
Correlation Heatmap of the Top Altered Genes
Examples
gggenecor(gnomeR::mutations)
#> ! `samples` argument is `NULL`. We will infer your cohort inclusion and resulting data frame will include all samples with at least one alteration in mutation, fusion or cna data frames
#> ! 7 mutations have `NA` or blank in the mutation_status column instead of 'SOMATIC' or 'GERMLINE'. These were assumed to be 'SOMATIC' and were retained in the resulting binary matrix.