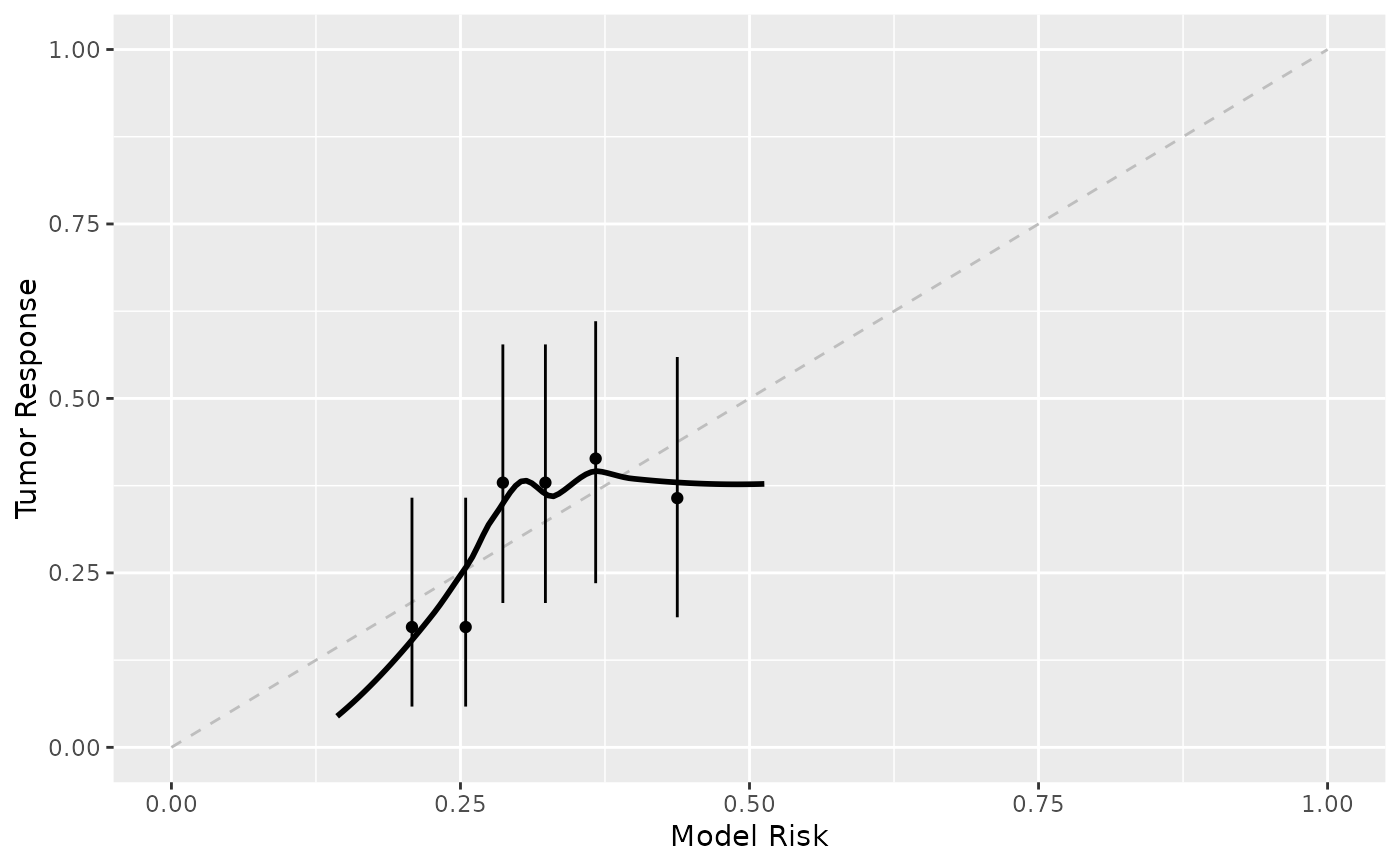
Assess a model's calibration via a calibration plot.
ggcalibration(
  data,
  y,
  x,
  n.groups = 10,
  conf.level = 0.95,
  ci.method = c("exact", "ac", "asymptotic", "wilson", "prop.test", "bayes", "logit",
    "cloglog", "probit"),
  geom_smooth.args = list(method = "loess", se = FALSE, formula = y ~ x, color = "black"),
  geom_errorbar.args = list(width = 0),
  geom_point.args = list(),
  geom_function.args = list(colour = "gray", linetype = "dashed")
)
Arguments
- data
a data frame
- y
variable name of the outcome coded as 0/1
- x
variable name of the risk predictions
- n.groups
number of groups
- conf.level
level of confidence to be used in the confidence interval
- ci.method
method to use to construct the interval. See
binom::binom.confint()for details- geom_smooth.args
named list of arguments that will be passed to
ggplot2::geom_smooth(). Default islist(method = "loess", se = FALSE, formula = y ~ x, color = "black")- geom_errorbar.args
named list of arguments that will be passed to
ggplot2::geom_errorbar(). Default islist(width = 0)- geom_point.args
named list of arguments that will be passed to
ggplot2::geom_point(). Default islist()- geom_function.args
named list of arguments that will be passed to
ggplot2::geom_function()and is the function that adds the 45 degree guideline. Default islist(colour = "gray", linetype = "dashed")
Value
ggplot