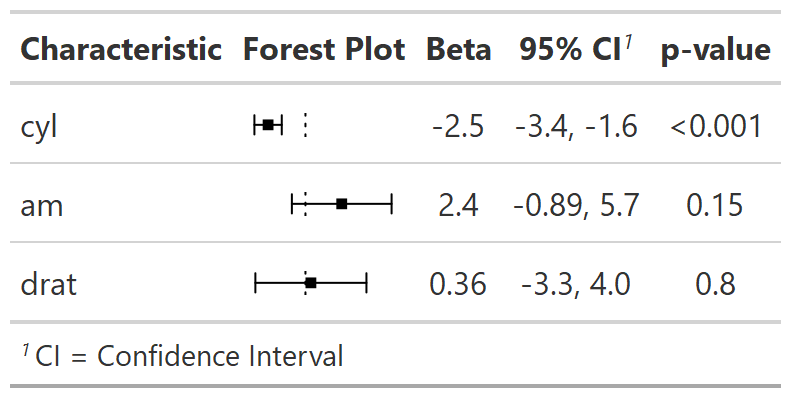
This function works with HTML output from the gt package only. Adds an in-line forest plot to a summary table.
add_inline_forest_plot(
  x,
  header = "**Forest Plot**",
  spec_pointrange.args = NULL
)
Arguments
- x
a gtsummary object
- header
string indicating column header of new forest plot column. Default is
"**Forest Plot**".- spec_pointrange.args
named list of arguments that will be passed to
kableExtra::spec_pointrange(). Use this argument to modify the default ascetics of the forest plot, e.g. color, size, symbols, etc. Default islist(width = 250, cex = .75, col = "black", pch = 16)
Value
gtsummary object
Details
Estimates from tbl_regression() and tbl_uvregression() that have
been exponentiated are shown on the log scale.
Example Output
See also
Other gtsummary-related functions:
add_sparkline(),
as_ggplot(),
bold_italicize_group_labels(),
logistic_reg_adj_diff(),
style_tbl_compact(),
tbl_likert(),
theme_gtsummary_msk()